At the beginning of 2018, one of the most famous vulnerabilities in history was publicly presented: Meltdown. Although it was a CPU vulnerability, most operating systems, including Windows, added mitigations for this attack. Despite the Windows mitigation being effective to prevent Meltdown, it also introduced a "design" problem which can be abused even today.
Note that Microsoft was contacted about this issue, and their position is that the KVA Shadow mitigation is not meant to protect KASLR. They specifically pointed out this design document, and in particular this part of the document:
"Note that one implication of this design choice is that KVA shadow does not protect against attacks against kernel ASLR using speculative side channels. This is a deliberate decision given the design complexity of KVA shadow, timelines involved, and the realities of other side channel issues affecting the same processor designs. Notably, processors susceptible to rogue data cache load are also typically susceptible to other attacks on their BTBs (branch target buffers), and other microarchitectural resources that may allow kernel address space layout disclosure to a local attacker that is executing arbitrary native code"
This blogpost will explain how Meltdown can still be used to leak some specific kernel data and break Windows KASLR in the latest Windows versions, including "Windows 10" 20H1.
![]()
Meltdown attack
The Meltdown attack consisted of dumping data from arbitrary kernel addresses, which could be used to leak sensitive data such (e.g. credentials) or used by kernel exploits to make exploitation easier and more reliable. The CVE assigned to Meltdown was CVE-2017-5754, which was presented as a "Rogue Data Cache Load" vulnerability.
Meltdown was presented at the same time as a second vulnerability discovered by the same researcher groups: Spectre. Moreover, it was discovered that AMD CPUs weren't affected by Meltdown, but were affected by Spectre.
It's important to clarify that the Meltdown vulnerability can be fixed via a CPU microcode update (not very common), or just using the newest Intel CPUs models based on the "Cascade Lake" microarchitecture (see https://en.wikipedia.org/wiki/Cascade_Lake_(microarchitecture)).
Meltdown details - Part 1
This attack is possible because of a race condition between memory access and privilege checking in the speculative execution mechanism, which allows reading kernel data from code running in user mode. This is not normally possible because of the permissions between user and kernel memory. However, Meltdown showed that this was still possible by abusing the side-effects of speculative execution.
At a very high level, speculative execution is performed by the CPU when it doesn't know the results of some operation (e.g. a memory access). Instead of waiting for the operation to complete, the CPU "speculates" the results and continues executing based on this speculation. When the results are known, the speculated code is either committed (i.e. its results are made visible) or simply discarded. In the best case the CPU has done work in advance, and in the worst case it has wasted some computing power instead of waiting.
Before understanding this attack, I (like most people) assumed that the effects of speculative execution were invisible to the code being run. However, this turned out to be far from the truth...
To see what we mean by this, let's start by analyzing an example similar to that of the original paper but using C instead of assembly:
leaker_function ( unsigned __int64 pos )
{
  if ( pos < array_size )
  {
    temp_value = array1 [ array2 [ pos ] ];
  }
}
And now, let's suppose that:
- pos is fully controllable by the attacker
- array_size is 1
- array1 is an unsigned char array with 256 elements
- array2 is an unsigned char array with 256 elements
- temp_value is just a temporary variable to read array1
From a quick analysis, the only way to reach the condition is with pos = 0, where the position 0 of array2 is read and the result is used as an index to read array1. The output is then assigned to temp_value.
In other words, any pos value bigger than 0 will not reach the code inside the if condition.
Now, let's imagine that this function is executed speculatively, where the if condition is assumed to be true for an arbitrary value of pos:
leaker_function ( unsigned __int64 pos )
{
  if ( pos < array_size ) //  1, array_size = 1, but branch predictor assumes branch is taken
  {
    temp_value = array1 [ array2 [ pos ] ]; //  if pos > 255, out-of-bounds access
  }
}
In that case any array2 position could be read, and then the loaded byte would be used as an index to read one element of array1. If pos value is big enough, it could be used to read kernel memory relative to the array2 base address, such as:
array2 [ 0xffff8000'12345678 ]
Or better, reading one byte at an arbitrary address as follows:
array2 [ 0xffff8000'12345678 - &array2 ]
The problem here is that this code is internally executed by the CPU and then discarded because the speculation was incorrect. Thus we can't really see the content of the loaded byte by array2[pos], or can we?
Meltdown details - Part 2
Here is where the second part of the Meltdown attack appears, in which the first part ("Rogue Data Cache Load" vulnerability) is combined with a cache side-channel attack. We said that it's not possible to see the result of array2 [ pos ], but its contents are immediately used as an index in array1 [ unknown ]. So, the trick here is to identify which element of array1 was accessed.
Although it may not seem very intuitive at first thought, it's possible to measure access times for specific memory areas like variables or elements of arrays from the code itself. Since CPUs use caches to store contents of recently accessed memory, and caches are significantly faster than regular memory, we get a chance to infer what element was accessed by observing the access time to different cache lines.
A typical way to infer which cache line was accessed is by first flushing all cache lines, then triggering a victim memory access and later timing the access to every cache line. The line that was accessed by the victim access would then produce the lowest timing.
This technique is usually known as Flush+Reload.
We can flush the cache lines for all elements of the measurement array by using the _mm_clflush intrinsic like:
for ( i = 0 ; i < 256 ; i ++ )
{
// Invalidating cache
  _mm_clflush ( &array1 [ i ] );
}
After this, we execute the function mentioned above (leaker_function) by activating the speculative execution. In the last step, it's necessary to know which element of the array was accessed. For that, we simply read every element of array1 and measure the access times by using the __rdtscp intrinsic.
Let's see an example where pos = 0xffff8000'12345678 - &array2, which means we are going to read the 0xffff8000'12345678 kernel address:
temp_value = array1 [ array2 [ 0xffff8000'12345678 - &array2 ] ];
And let's suppose the content of array2 [ 0xffff8000'12345678 - &array2 ] is 0x41, thus the following access occurs:
temp_value = array1 [ 0x41 ];
So, when the code is executed speculatively, the position 0x41 of array1 will be accessed, and the CPU will keep cached the position 0x41 of array1. When checking element by element of the array, the access time for this position should be lower than that of all other positions. If it happens, we can assume that the loaded byte value was 0x41, which means the content of the 0xffff8000'12345678 kernel address is 0x41.
Summarizing, the steps to implement the Meltdown attack are:
- Flush the CPU cache for every element of the array
- Execute "leaker_function" such that out of bounds memory is accessed during speculative execution
- Check access time for every element of the array and get the best one
Of course, this is a limited explanation about how the attack really works, and other things must be considered, but this should be sufficient to understand the general principles.
Meltdown details - Part 3
By this time, the question is, how do we enable speculative execution? Well, one way to do that is by creating code, which does some "obfuscated" calculations, and then put this one in a loop condition. When the CPU detects this repetitive code, the "out-of-order" execution is activated, which tries to optimize the execution by finding all possible execution paths, either valids or "probably" valids. Depending on the taken execution path, the CPU could read memory in advance.
When the execution flow finally reaches the condition to read that memory, the access time should be faster because it was cached by the CPU before. Using as inspiration a PoC located here, we can see a way to trigger the speculator and leak kernel memory like the following:
// Kernel address to be read
malicious_pos = kernel_address - &array1;

// Looping 33 times
for ( i = 0 ; i <= 33 ; i ++ )
{
// Enabling speculator
  pos = ( ( i % 33 ) - 1 ) & ~0xFFFF;
  pos = ( pos | ( pos >> 16 ) );
  pos = pos & malicious_pos;

// Leaking data when branch predictor is working
  leaker_function ( pos );
}
Meltdown details - Some considerations
It's really important to say that to be able to leak kernel data from user mode using this attack, the data has to be cached by the CPU, otherwise there is no way to leak anything. For this reason, the attacker has to find a way to cache the target data, either by calling kernel API's or just raising exceptions, but ensuring that this data is being used by the CPU all the time.
Another important thing to say is that, the CPU usually uses a cache line of 64 bytes (64-byte cache block), which means that, if we are able to force the CPU to cache the content of the kernel address X, the whole cache line will be loaded, which will give us the chance to leak any byte of this 64-byte range, without limiting the leaking to a single byte.
Intel Paging Tables
When AMD released the 64-bit processor, which was based on the Intel x86 instruction set, the addressable virtual memory was increased from 2^32 (4 gigabytes) to 2^48 (256 terabytes). Although the CPU works in 64 bits mode, only 48 bits are used to address virtual memory (canonical addresses where the top 17 bits are all equal to 0 or to 1). To do that, the CPU skips 16 bits of the virtual address range by splitting the virtual memory in two parts and putting a big hole in the middle (non-canonical addresses).
The virtual memory ranges are:
- 0x00000000'00000000 ~ 0x00007FFF'FFFFFFFF (canonical)
- 0x00008000'00000000 ~ 0xFFFF7FFF'FFFFFFFF (non canonical)
- 0xFFFF8000'00000000 ~ 0xFFFFFFFF'FFFFFFFF (canonical)
To be able to map 48 bits of virtual memory, the CPU increased the paging levels from 2 to 4.
From highest to lowest level, the names of the paging tables are:
- PML4
- PDPT (Page Directory Pointer Table)
- PD (Page Directory)
- PT (Page Table)
In these four paging levels, every table has 512 entries (0x200), where every entry is 8 bytes. So, the size of each table is 0x200 * 8 = 0x1000 (4 KB).
Ordering from lowest to highest level:
- Every Page Table entry (PTE) can address 4KB (0x1000 bytes).
- Every Page Directory entry (PDE) can address 2MB (0x200 * 4KB = 0x200000 bytes).
- Every Page Directory Pointer Table entry (PDPTE) can address 1GB (0x200 * 2MB = 0x40000000 bytes).
- Every PML4 entry can address 512GB (0x200 * 1GB = 0x8000000000 bytes).
Finally, if we multiply the entries of the PML4 by 512GB, we can obtain the full addressable virtual memory:
0x200 * 512GB = 0x10000'00000000 (256 terabytes)
In the following picture, we can see the 64-bit paging level model:
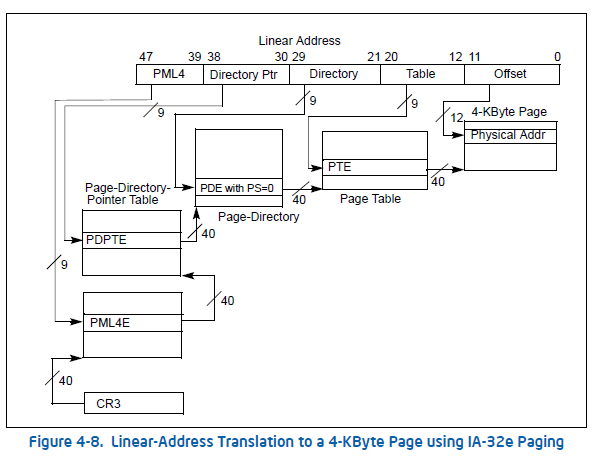
From a quick look, we can see that every entry in every paging level has a similar format: it is divided in two parts, the permissions and the physical address (PFN) pointed by the entry.
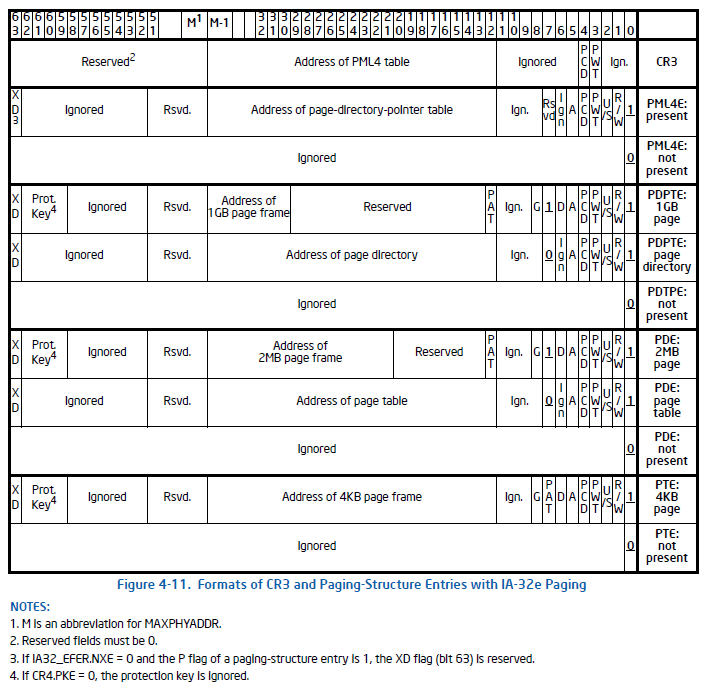
Among the most important protection bits, we can mention:
- XD: eXecute Disable (bit 63) - usually known as NX bit (no-execute)
- PS: Page Size (bit 7) - Only present in PDPTEs and PDEs
- U: User/Supervisor (bit 2)
- R: Read/Write (bit 1)
- P: Present (bit 0)
Where the meaning of every bit is the following:
- XD: Memory is not executable when enabled, otherwise it's executable
- PS: It's a large/huge page, otherwise it's a normal page
- U: Memory is accessible from User mode, otherwise it's a kernel page (Supervisor)
- R: Memory is read-only, otherwise it's writable too
- P: Memory is mapped, otherwise it's not mapped
If the PS bit is enabled, the lower paging levels are ignored, and depending on the level where it's enabled, the page size can be 2MB or 1GB.
Note: Before 64-bit Intel CPUs, 3-level paging systems were used by 32 bit CPUs to be able to address up to 64GB of physical memory by using PAE support (Physical Address Extension), where the PDPT table was in the highest level.
Windows Meltdown fix
On January 3, 2018, Microsoft released a fix for the Meltdown vulnerability. This Meltdown mitigation was called KVA Shadow, which was based on the KPTI (Kernel Page Table Isolation) solution implemented by Linux. Basically, this mitigation consists of unmapping most kernel memory pages while executing in user mode in order to reduce the attack surface. This way, the Meltdown attack is mitigated, basically because there is nothing to leak even if the CPU is vulnerable.
The mitigation is based on using two different paging tables: one for kernel mode execution and one for user mode execution. The PML4 used for kernel mode is full, so user and kernel memory are completely mapped. In contrast, the PML4 used for user mode is the so-called Shadow PML4, which maps all user memory and just a small portion of kernel memory.
In the screenshots below, we can see a full PML4, and a Shadow PML4 where many entries are not present.
Full PML4

Shadow PML4

The transition between Shadow and full paging tables is done in kernel mode when a user process invokes a syscall or just produces an exception (e.g. division by zero, invalid access memory, etc).
Note: Code running in High Integrity Level, like applications launched from the "Run as Administrator" option don't use Shadow PML4s.
Windows SMEP by software
The SMEP (Supervisor Mode Execution Prevention) feature by hardware was introduced with the Intel Ivy Bridge microarchitecture. Basically, this feature was added to avoid executing userland code in kernel mode, something frequently used in the past by kernel exploits. This feature is present on most modern computers nowadays.
Despite this hardware protection, and because the use of two different PML4s to implement the Meltdown mitigation, Microsoft decided to take advantage of this one adding a security improvement by implementing SMEP by software.
In the following picture, we can see the user entries from a full PML4:
Looking at the red marks, we can see that the user entries of the PML4 are set with the XD bit (see https://en.wikipedia.org/wiki/Executable_space_protection), which means that all userland code is NOT executable in kernel mode. This way, computers with old CPU models should be protected against kernel exploits as if the SMEP feature was present. In a few words, any kernel exploit that tries to execute userland code will crash.
It's important to clarify that this SMEP hardware protection could be directly bypassed when ROPing by using the technique described in the "Windows SMEP bypass: U=S" presentation (https://www.coresecurity.com/core-labs/publications/windows-smep-bypass-us) or just by disabling this feature from the CR4 register (20th bit). With the software-based SMEP implementation the same techniques can be used, but it's necessary to add an extra step by disabling the XD bit in the PML4 entry related to the target virtual address.
PML4 in Windows before randomization
As mentioned before, the PML4 table is the highest paging level in 64-bit memory models. In Windows, this table is used to separate user and kernel memory, just by using the lowest 0x100 entries (256) to map user memory, and the highest 0x100 entries to map kernel memory. Knowing that every PML4 entry can map 512GB (0x8000000000 bytes) and there are 0x100 entries assigned for user mode, we can deduct the user virtual address range just by doing the following calculation:
user address range: 0 ~ 0x100 * 0x8000000000
Which is the same as:
user address range: 0 ~ 0x00007FFF'FFFFFFFF (0x8000'00000000 - 1)
Because a special technique used by Windows for paging management, called "self-referential", which consists on a PML4 entry pointing to itself (pointing to the PML4 table which contains the entry itself), the virtual addresses for the whole paging tables can be calculated just by knowing the address of the PML4 table. At the same time, the address of the PML4 can be calculated just by knowing which PML4 entry was used as "self-referential" by the Windows kernel after booting.
Below is a PML4 screenshot where a self-referential entry can be seen:

Originally, this table was always allocated at the same kernel address, because the entry which used to do that was in a fixed table position, located at the 0x1ED entry. It's possible to calculate the original Windows PML4 address just by doing the following calculation:
0xFFFF0000'00000000 + ( 0x8000000000 + 0x40000000 + 0x200000 + 0x1000 ) * 0x1ED = 0xFFFFF6FB7DBED000.
The address 0xFFFFF6FB7DBED000 was used in all Windows versions until it was randomized.
PML4 in Windows after randomization
The Windows paging tables randomization was introduced in "Windows 10" v1607 (RS1 -"Anniversary Update"), which was released in 2016. Since it's still using the self-referential entry technique, the randomization was limited to 256 positions in the PML4 table, which means that the table can only be allocated in 256 different kernel addresses, i.e. a really poor randomization. As described in the previous section, the PML4 table address can be calculated by knowing which PML4 entry is self-referential.
If we want to know all PML4 possible addresses, we can do something like the following:
for ( entry = 0x100 ; entry < 0x200 ; entry ++ )
{
  pml4_address = 0xFFFF000000000000 + ( 0x8000000000 + 0x40000000 + 0x200000 + 0x1000 ) * entry;

  printf ( “PML4 address: %llx\n” , pml4_address );
}
Since this table was randomized and no Windows API can tell us where this table is located, the abuse of the paging tables by kernel exploits was decreasing.
PML4 in real exploitation scenarios
The use and abuse of paging tables by kernel exploits is not very popular, most likely due to the need for a good understanding of the paging system. Indeed, using memory contents to map other memory is not a trivial concept.
On the other hand, modifications to the paging tables can be used to build primitives such as arbitrary kernel read/write and even kernel code execution. Additionally, they can be performed even by kernel exploits running at any integrity level, including Low IL. This makes them a very powerful way to escape from the hardest sandbox implementations like the Chrome renderer process.
Some techniques which are based on the abuse of paging tables are listed below:
- Double write: overwrite a user PDE and a user PTE by pointing both to the same physical address, which gives us the control of a whole PAGE TABLE from user mode, which can be used as a read/write primitive!
- Huge page: overwrite a user PDPTE by enabling the 'PS' bit and creating a HUGE PAGE, which gives us the ability to read/write 1GB of consecutive physical memory by starting from the physical address set in the PDPT entry.
It's important to clarify that this "huge page" feature has been present in CPUs for some time, but we can still find computers that do not support it. - Large page: overwrite a user PDE by enabling the 'PS' bit and creating a LARGE PAGE, which give us the chance to read/write 2MB of consecutive physical memory by starting from the physical address set in the PDPT entry.
Although it's not as powerful as the "Huge page" option, it could be useful in some scenarios where we have some information about the content of the physical memory to be mapped, like creating a large page by using the NULL physical address (PFN number 0) and reading or writing the content of the HAL heap. - Target page: overwrite a user PTE by setting an arbitrary physical address. This is the least common scenario, but it is the simplest option if you know exactly in which physical address the data you want to read or write is mapped.
- Self-referential entry: Create a self-referential entry in some of the four paging levels. If we know the physical address of one user paging table, we could overwrite an entry pointing to itself, which provides a read/write primitive by manipulating this table from user mode, like the "Double write" technique described above.
- SMEP bypass: overwrite a user PTE by disabling the 'U' bit by converting our user code to kernel code.
Depending on the technique mentioned above, it may only be necessary to turn on just some bits to create a valid paging table entry, which means it's really useful for most write-what-where conditions produced in kernel exploits.
PML4 exposure in Windows after Meltdown fix
At this point, it's necessary to say that the Windows Meltdown fix has a "design" problem, where not all kernel sensitive data is hidden from user mode. As mentioned before, two different PML4s are used to mitigate the Meltdown attack, which a shadow PML4 is used by the CPU when running in user mode.
And here comes the problem: The Shadow PML4 is mapped in Shadow kernel memory, which means that it's exposed to user mode even with the implemented Meltdown mitigation. This way, and as consequence of the self-referential entry technique, all mapped paging tables by the Shadow PML4 can be leaked by using the Meltdown attack!
It's really important to clarify that, although properly setting the PML4 up is critical for a working virtual memory implementation, it's not really necessary to map it in virtual memory, or at least not mapping it permanently but just mapping when it's needed instead. It's clear that in some cases, when user memory is mapped by user code, the Windows kernel has to refresh both the shadow and the full PML4.
This refresh is done in kernel mode, where the full PML4 is used, not the shadow one. So, since the Shadow PML4 is only a memory block of 4KB, this table could be mapped in any part of kernel space like any other memory allocation, without exposing it to user mode.
Having said that, the reason for mapping paging tables in the shadow PML4 is not really clear, except for performance issues between context switches between shadow to full mode and vice versa. In the following screenshot, we can see how the Meltdown attack is able to dump the first part of the PML4 in the latest "Windows 10" version (20H1), which is related to the virtual address range 0~0x380’00000000 (0~7GB):
Of course, to be able to leak the data shown in the above picture, it's necessary to know where the paging tables are allocated.
PML4 derandomization via Meltdown
In the PML4 in Windows after randomization section described above, we can see that the PML4 randomization is poor and it can only take 256 different addresses. Besides, looking at the previous section, we can see that it's possible to leak data from paging tables by using the Meltdown attack.
Finally, the permission flags used by the self-referential entry are represented by the value 0x63 (Dirty, Accessed, Writable and Present) and its offset into the PML4 is determined by the address of the PML4 itself. Thus, finding an entry with this byte set to 0x63 at the right offset using Meltdown allows locating the PML4. Putting all this together, we can deduce that it's possible to know where the PML4 table is allocated just by executing the following code:
for ( entry = 0x100 ; entry < 0x200 ; entry ++ )
{
  pml4_address = 0xFFFF000000000000 + ( 0x8000000000 + 0x40000000 + 0x200000 + 0x1000 ) * entry;

// Kernel address used to leak a single byte
  if ( leak_byte_via_meltdown ( pml4_address + entry * 0x8 ) == 0x63 )
  {
  // PML4 found!
    return ( pml4_address );
  }
}
In the following screenshot, we can see how this table address is derandomized by using Meltdown in around 16 milliseconds.
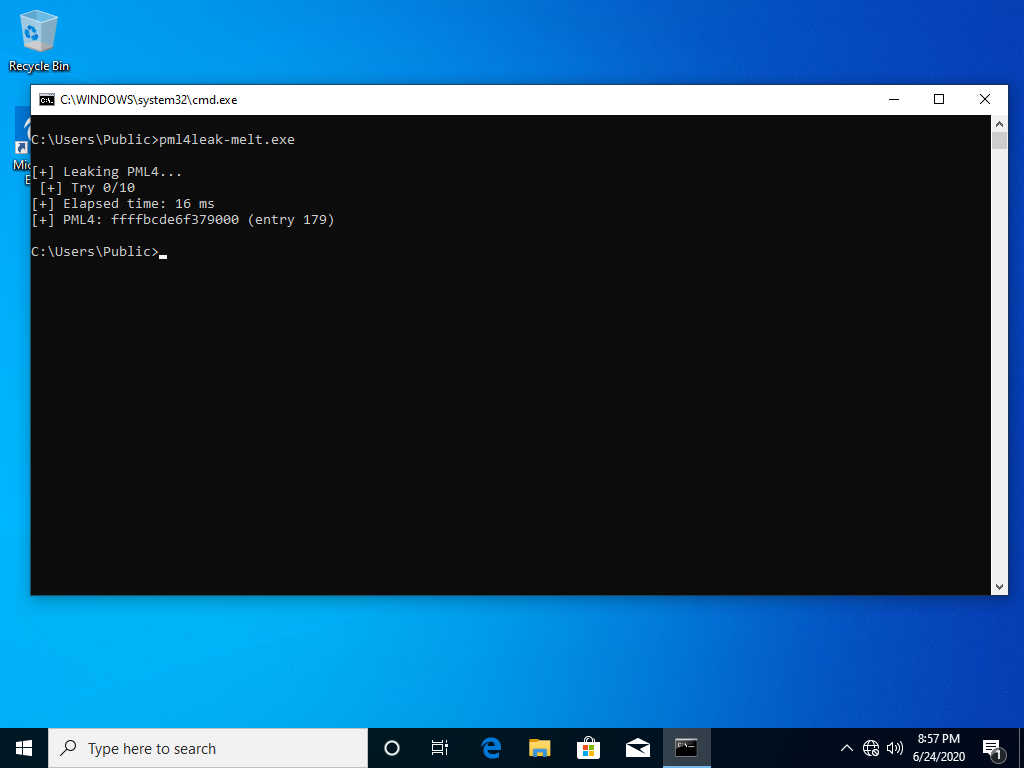
This PML4 leaker can be downloaded here.
PML4 derandomization (conclusions)
The derandomization explained above breaks the effort made by Microsoft to randomize the paging tables, making them predictable again. Since the PML4 address can't be obtained by calling any Windows API, this technique is really useful for any kernel privilege escalation exploit, either running at Low or Medium Integrity Level.
It's important to mention that before Meltdown existed, another PML4 derandomization technique was presented at Ekoparty in the "I Know Where Your Page Lives: De-randomizing the Windows 10 Kernel" talk (video), which was given by Enrique Nissim (@kiqueNissim) in 2016.
NT leak via Meltdown (intro)
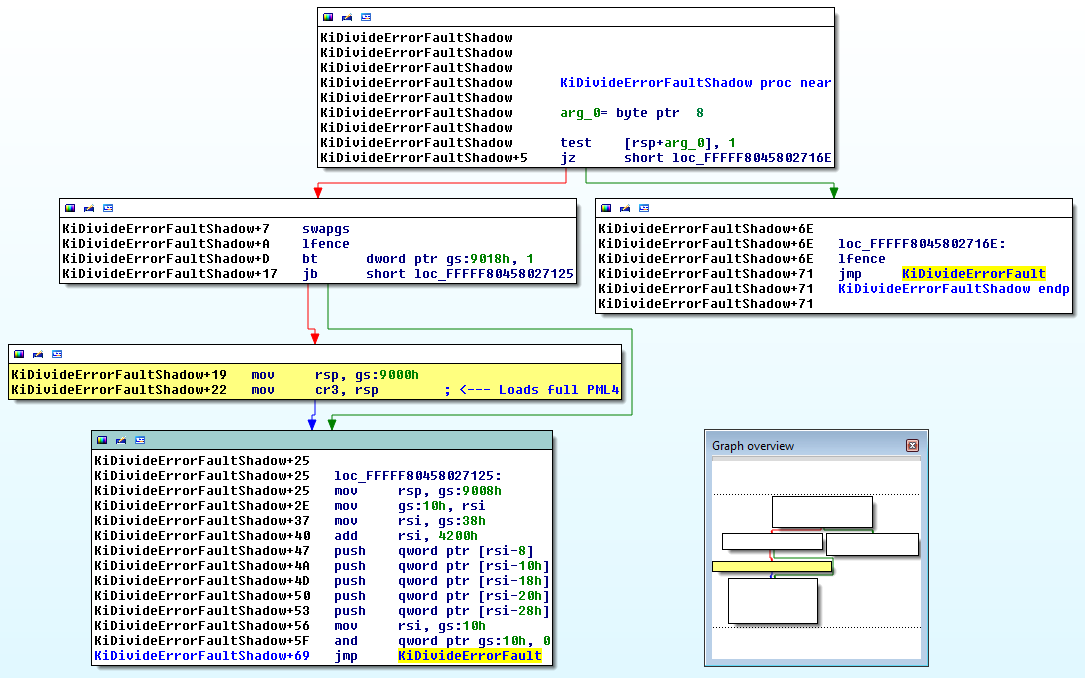
With the arrival of the Meltdown fix, a group of new NT functions appeared. These functions were added to be able to handle syscalls and user exceptions when this mitigation is enabled. All these new functions have names similar to the original ones, except just by adding the Shadow postfix to the name. For example, the division by zero exception function was originally named KiDivideErrorFault and now is KiDivideErrorFaultShadow.
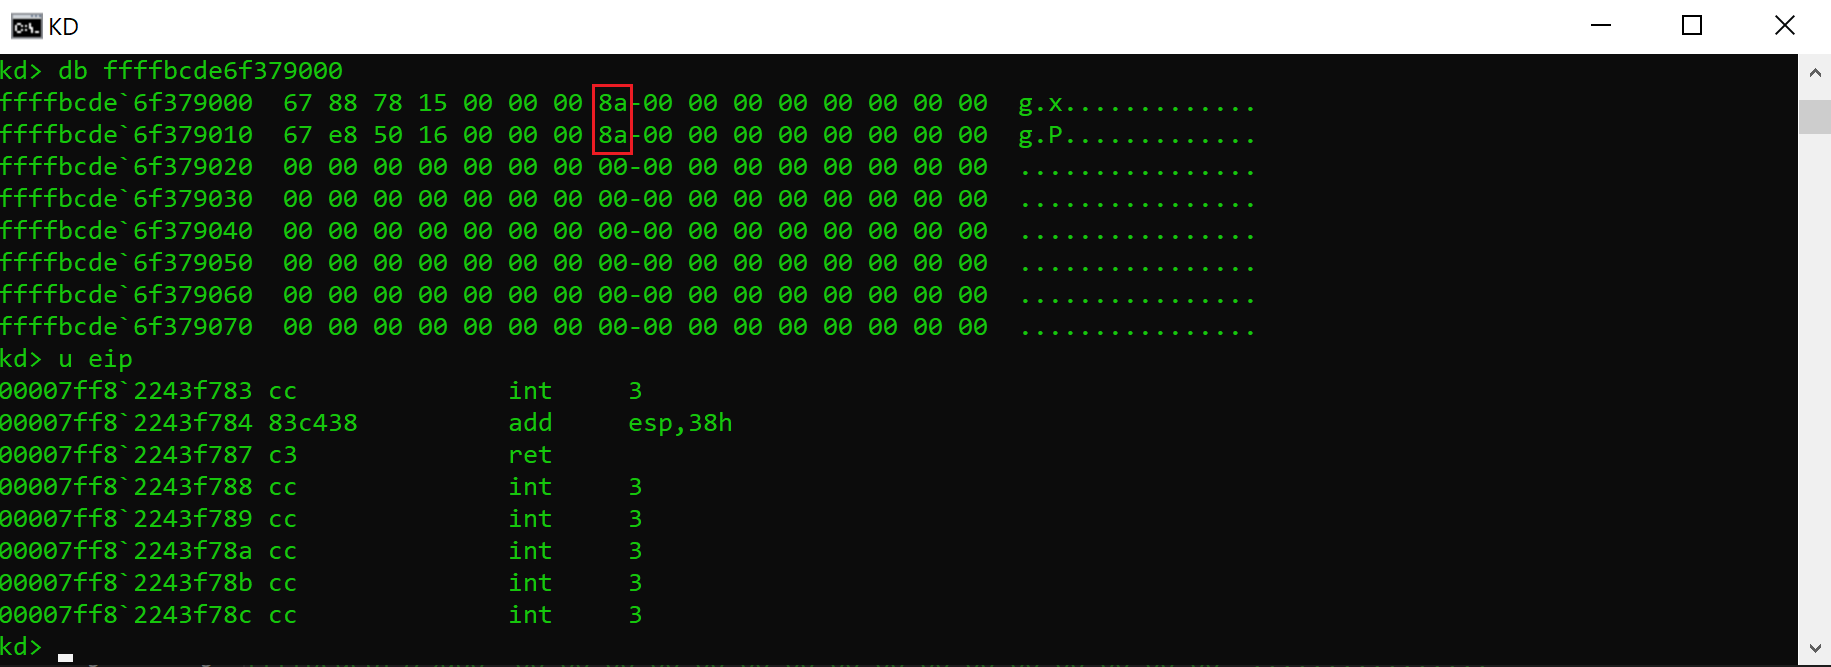
These Shadow functions are just wrappers around the original ones, where the context switch from Shadow to full paging tables is done. In the following screenshot, we can see how the full paging tables are loaded when setting the CR3 register:
All this code was put in a file section called KVASCODE, which is located in the ntoskrnl.exe module, where the size of the section is 0x3000 bytes (3 pages). Since syscalls and exceptions have to be present to keep the OS working, it's necessary to map this one in the Shadow side, which means they have to be exposed to user mode. If paging table entries can be read by using Meltdown, it makes sense to think that it's possible to leak the location where this Shadow code is mapped too.
NT leak via Meltdown
As explained above, the Intel 64-bit memory model uses four paging table levels, where usually the lowest level (PAGE TABLES) is used to map virtual memory. To be able to detect where the Shadow code is located, it is necessary to detect which PTEs are being used to map this code section. Since this is an executable section, the corresponding PTEs have the XD bit disabled, which makes it easier to identify the Shadow code.
So, using Meltdown, which gives us the ability to read the content of the paging tables, it's possible to find this code by processing the four paging levels by starting from the Shadow PML4, and passing to the next lower level when a valid entry appears. If this process is repeated and three consecutive executable PTEs are found, it means the Shadow code has been found. Using Meltdown, it's possible to do that just by doing the next steps:
for ( pml4e = 0x100 ; pml4e < 0x200 ; pml4e ++ ) // Starting from 0x100 because user/kernel division
 for ( pdpte = 0 ; pdpte < 0x200 ; pdpte ++ )
  for ( pde = 0 ; pde < 0x200 ; pde ++ )
   for ( pte = 0 ; pte < 0x200 ; pte ++ )
    if ( is_three_consecutive_executable_PTEs ( pte ) == TRUE )
      Shadow NT code found!
Once this section code has been found, the last step is to subtract the delta offset from the KVASCODE section to the "ntoskrnl.exe" base address like the following:
NT base = KVASCODE_address - KVASCODE_delta_from_NT
Since this Shadow code is part of NT, getting the base address is just a simple subtraction. It's important to clarify that this section offset (delta) changes between Windows releases, but it's usually the same for different "ntoskrnl.exe" versions of the same release.In the case of Windows 20H1 "May 2020 Update", the offset from the NT base address is 0xa21000 bytes, which is the same as 0xa21 pages.
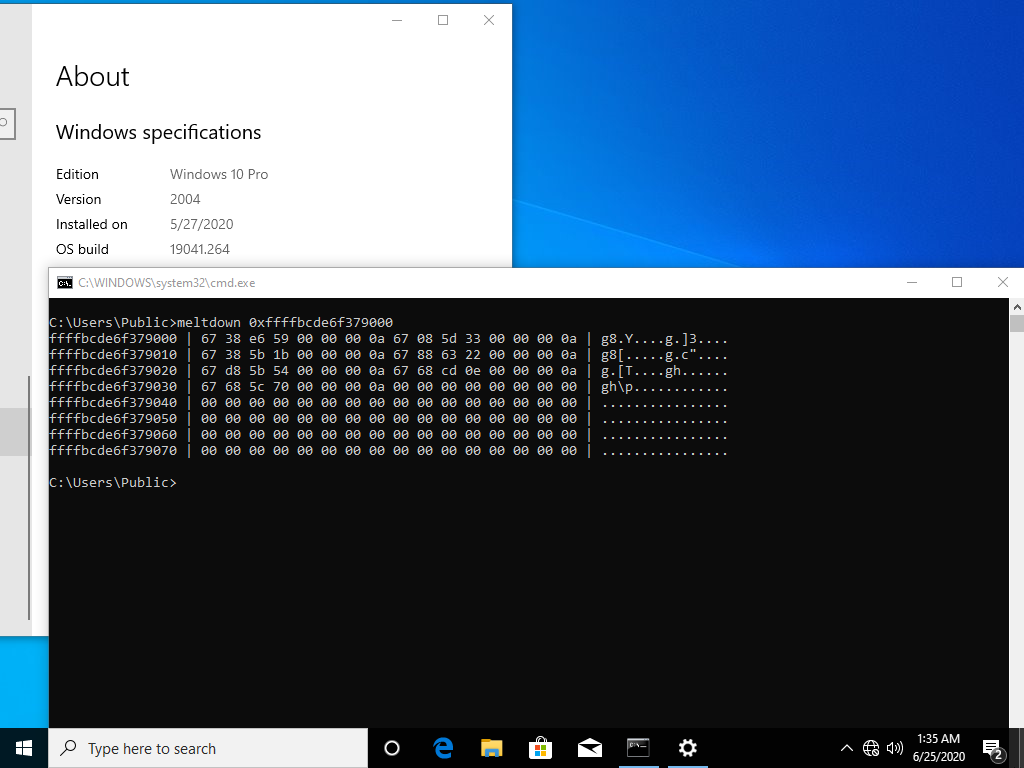
In the following screenshot, we can see how the "ntoskrnl.exe" base address can be obtained in 900 milliseconds:
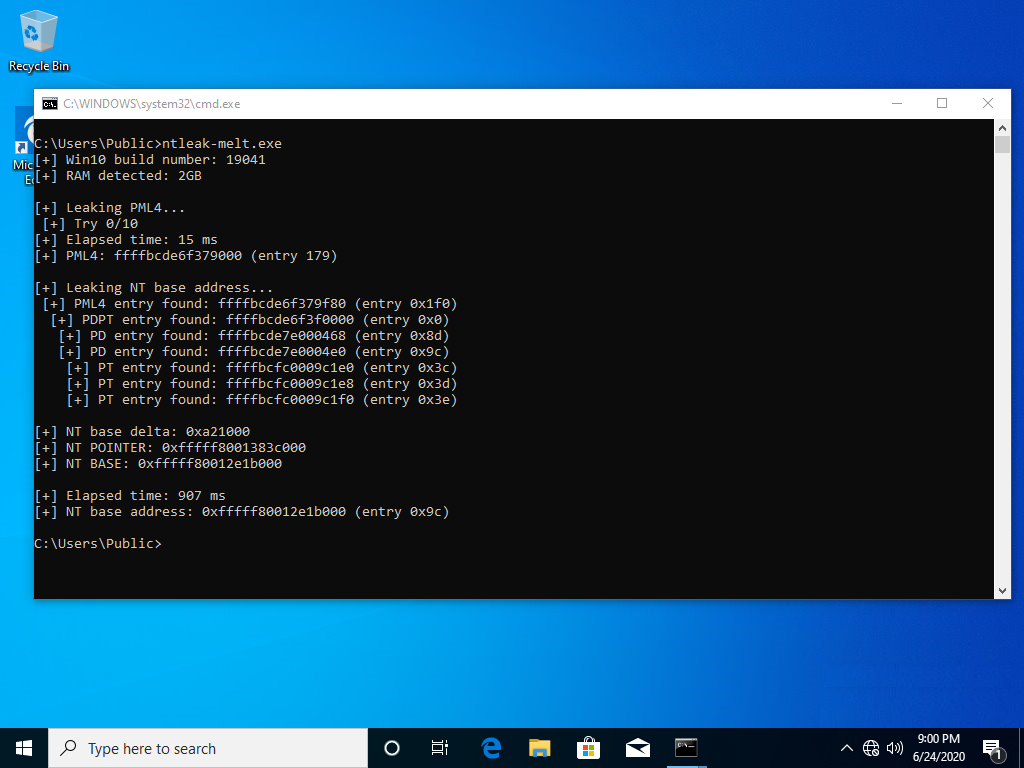
This NT base address leaker can be downloaded here.
Note: Starting from "Windows 10" RS6, when running on computers with RAM memory equal or higher than 4GB, the base address of ntoskrnl.exe is aligned to 2MB.
In this case, the detection of the KVASCODE section is much faster because the offset in the PAGE TABLE is fixed, which considerably reduces the leaking process to 1/512 tries, and it makes this process easier by just leaking the content of only one executable PTE.
NT leak via Meltdown (conclusions)
Leaking the base address of NT is a very common technique used by kernel privilege escalation exploits, where it's used to locate the SYSTEM and the current EPROCESS structure from the PsInitialSystemProcess linked list, and then to locate the TOKEN structure, which is used for getting SYSTEM privileges.
Getting the NT base address is trivial when running in Medium Integrity Level, and it can be obtained just by calling the NtQuerySystemInformation function. In processes running at Low Integrity Level, usually sandboxed, it's necessary to have an information disclosure bug to get the NT base address as described earlier. Most of them time, information disclosure vulnerabilities are absolutely necessary to escape from constrained processes, like sandboxes used by browsers such as Chrome, Edge or Firefox.
Final notes
Although Meltdown was a really famous attack and all operating systems running under Intel CPUs were affected, there is no full evidence of it being used in the wild. Even worse, there are not many public kernel exploits using Meltdown for Windows exploitation, except for some proof of concepts. This blogpost is a proof that this attack is still useful even with the Meltdown mitigation enabled, and it can be used in practical attacks to break Windows KASLR, which can then be used to escape from any sandboxed application in combination with a kernel privilege escalation exploit.